Creating database diagram in Access will help you in easy view of table relationships and print your diagram for reference or planning. Learn how to create a database diagram..
Go to the Database Tools tab in the ribbon and click Relationships option from this.
This will launch the relationships window, with the figure of all relationships.

Access will show objects that are in relationship. However you can view all tables and queries to see if any of these are missing from the diagram.
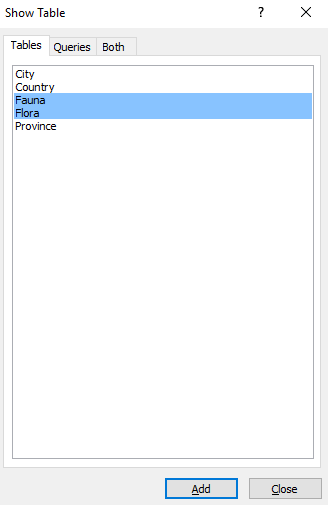
To do this, click the Show Table button on the ribbon from the Design tab to launch the Show Table dialog box.

Select the objects you want to add to the diagram and click Add. Tap to the Close option once you are done.
Now tap or drag the objects around the window to provide a clearer picture of the objects and their relationship with each other.
In order to expand the object’s height, drag or click on their bottom edge.

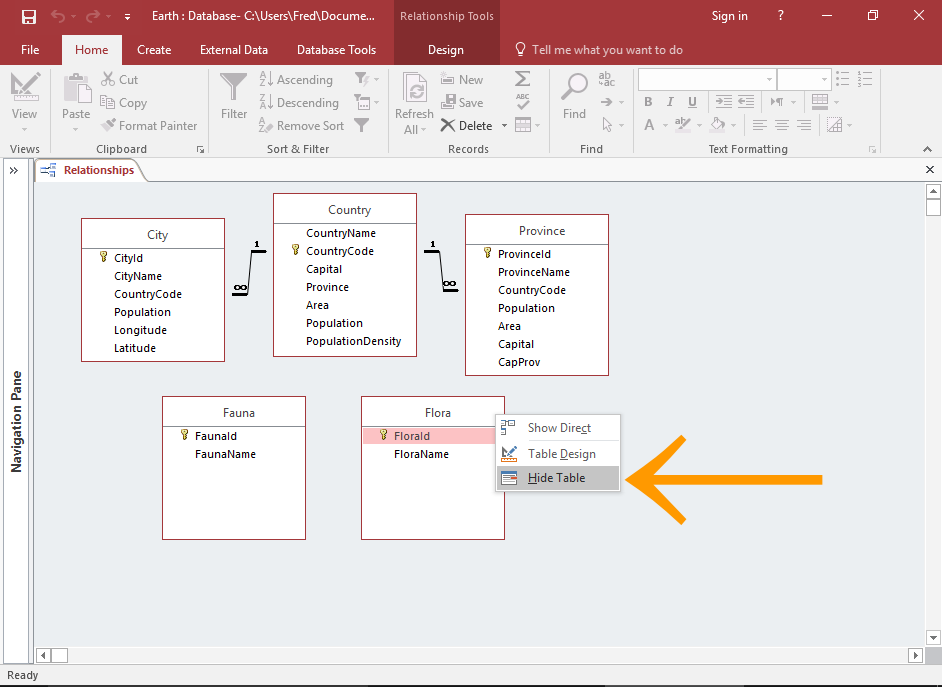
Remove an object from the diagram, right click on the object and select Hide Table from the contextual menu.
Once you get the satisfied diagram, you can save the layout so that when you open the Relationships Window in the future, the objects will be look arranged in the way you have just arranged them.
To do this, make a right click on the diagram pane and click save layout from the
Contextual menu.

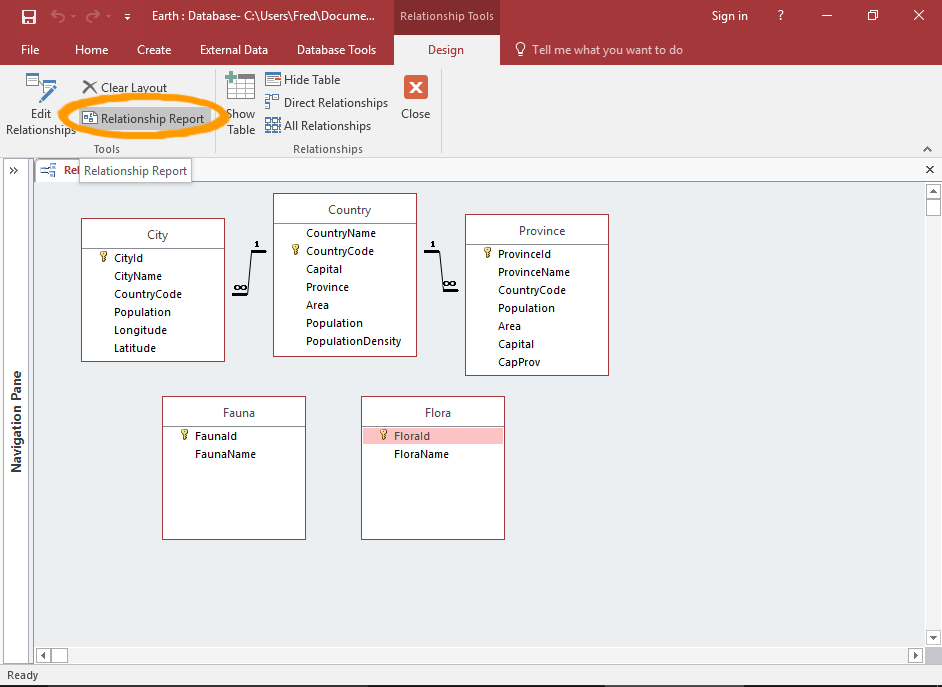
Access will automatically generate a report as per your diagram.
To generate this report, tap Relationship Report on the Ribbon from the Design tab.
The report will open in print preview. But don’t worry as you can switch to design view to make editing in your report, save it, export it, print it etc. just like any other reports.
