A grouped report is where one or more fields are used to group the other fields. This will be easier to handle if one field lots of repeating values. As you can display the value once and then display all records that belongs to that group. In order to create such grouped report making use of the report wizard in Access 2016 is the best idea to accomplish this task..
On the ribbon from the Create Tab, click Report Wizard

Select the fields you wants to appear on your report, you can select fields from more than one table or query.
For this, you just need to select the table or query using the drop-down list.
Double click the fields in the left pane to shift it across to the right pane. Repeat this for each field which you wish to appear in the report. The fields in the right pane will appear in the report.
Repeat for each relevant table/query. After completing all this, click Next.

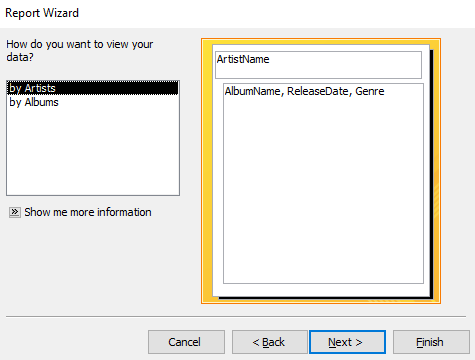
Select the table or query which contains the field that report needs to be grouped by.
Right pane will display preview based on your selection. After then click to the Next option.
Access allows you the option to specify more grouping levels if required. After then click Next option.

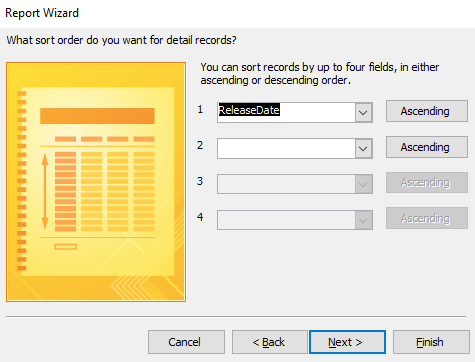
Specify the fields to sort the report details by. This sorts the field within each group, once completed, click Next option.
Choose the Preset Layout for the report.
Preview will update when you select an item. So freely select each item to view how it affects the layout.
Also change the orientation to landscape if needed. Once completed, click Next.

Assign name for the report. You can either see preview of the report or modify its design once the wizard has finished creating it. Tap to the Finish option to generate the report.

Your report is ready now. It is groped just as you have specified.
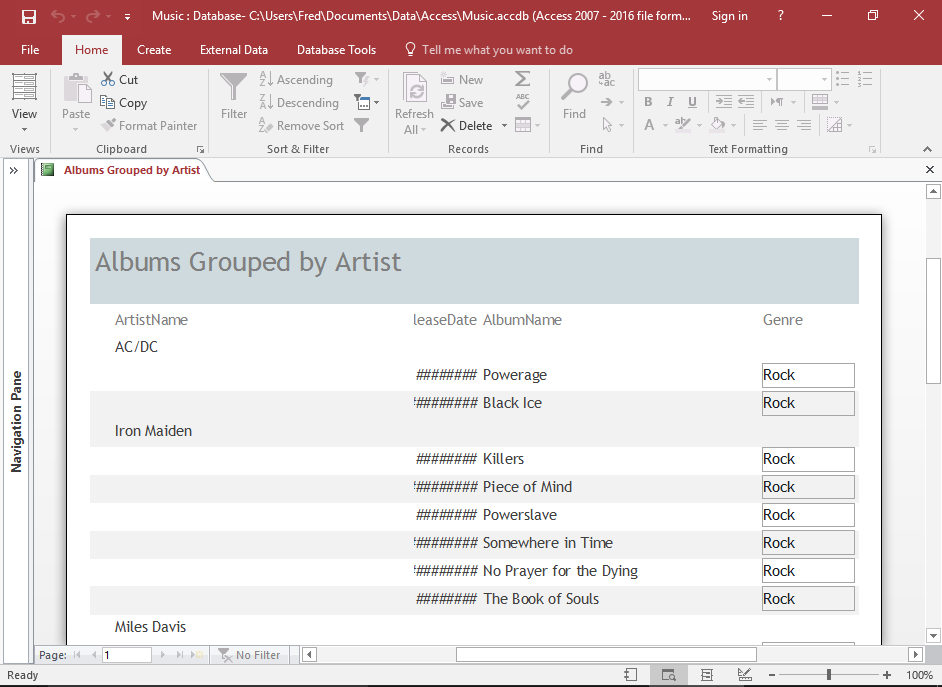
You can use several of the reformatting option to make the report look more presentable.
Access puts border around fields. You don’t want the border then simply delete it. For this, you just need to select the fields you want to remove the border from.
Now click to the shape outline option from the format tab on the ribbon and select Transparent from the contextual menu.

In order to remove the alternating colors, just select the report detail section in design view. After then click Alternate Row Color from the Format tab on the Ribbon, and then select No Color from the contextual menu.
You have to do the same thing for the grouped fields also. In order to select the grouped field, select FieldName Header where fieldname is the name of the grouped field.

If you view the report in print preview, then it will display the report without the alternating colors.
